
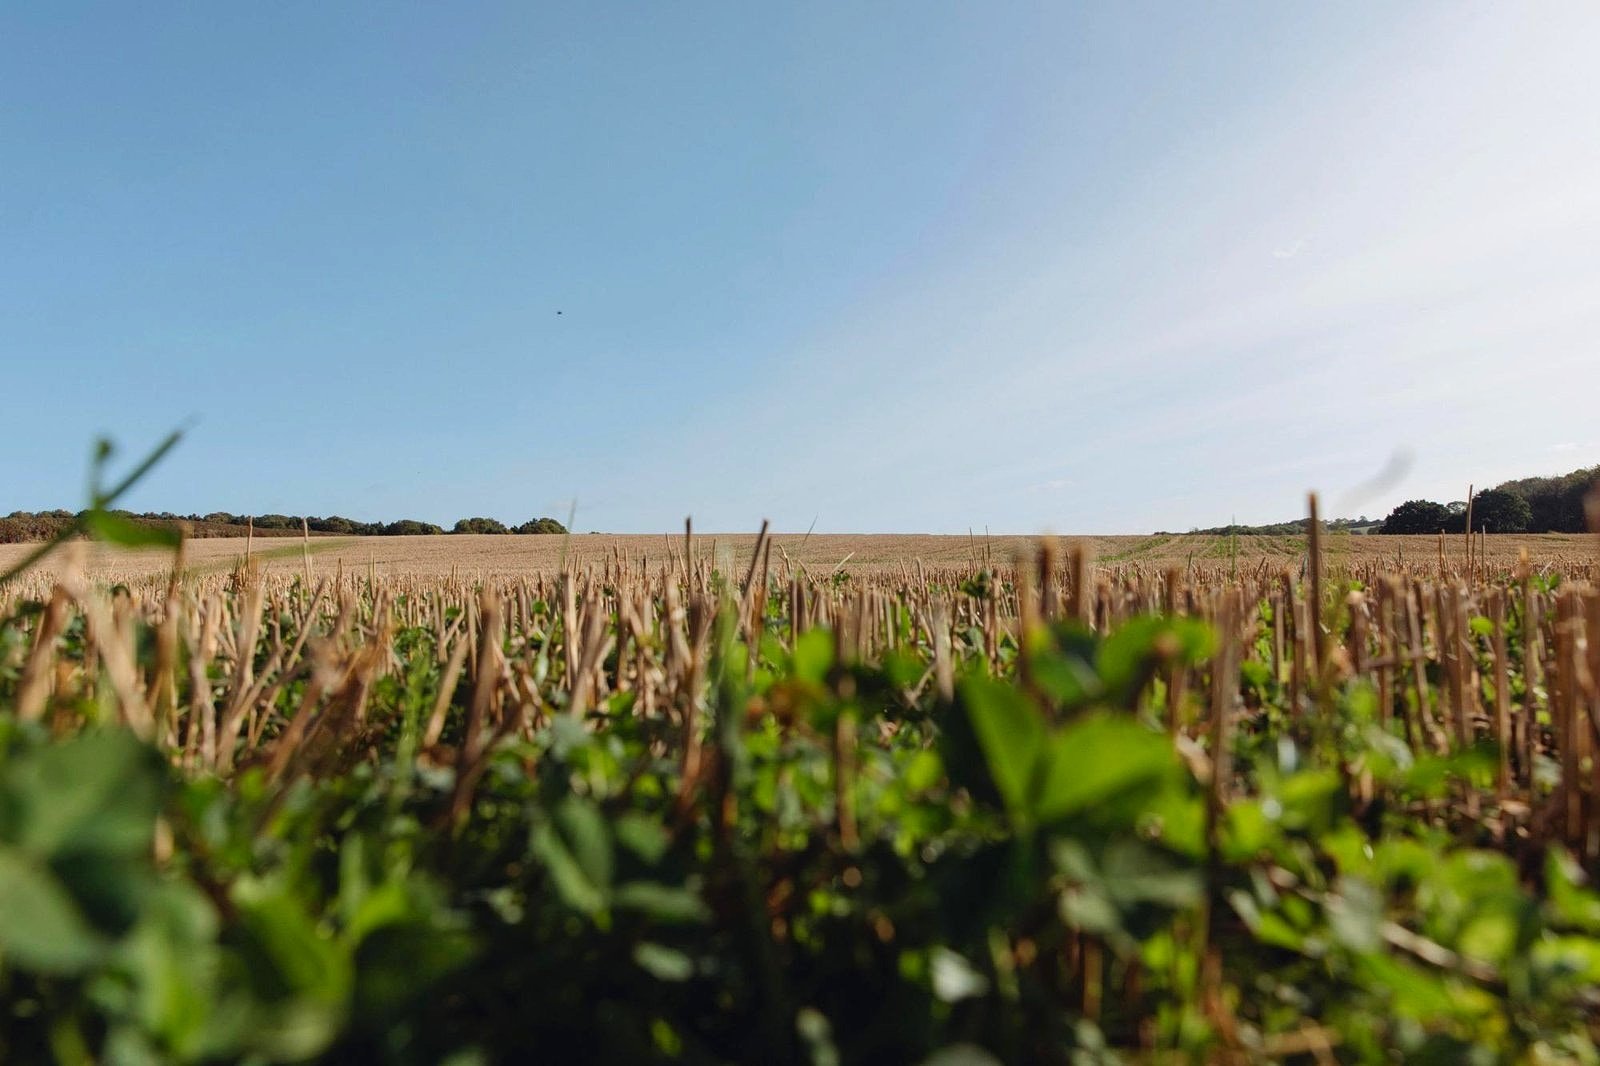
The short answer. Across our UK monitoring programmes we are seeing an emerging relationship between soil organic carbon stock change and yield stability. Stable and increasing carbon stocks protect the following year’s yield against too much water or too little. Over the 2025 and 2026 growing seasons, projects with declining soil organic carbon averaged yield losses of 20 to 50% in drought conditions, while projects with stable or increasing carbon typically stayed within 5 to 15% of average. It is an observed pattern rather than a promise, and it is the clearest early warning a farm has for the condition of its own production machine.
Reviewed by David Wright, founder and CEO of Ecometric. Last reviewed September 2026.
Two droughts in five years
We measure the same fields year after year to track the effect of each rotation on the soil. In the UK, five annual monitoring cycles have included two droughts, and the pattern comes from our UK projects in the 2025 and 2026 seasons. Across all our work we have measured more than 300,000 hectares in 11 countries. The fields that held their carbon held their yield.
Without monitoring soil health, yield risk goes unseen until the next weather event strikes. This risks business continuity at farm level and food security at national scale. Measuring does not stop a drought. It tells you whether your soil is getting better or worse at handling one.
Two growing seasons, measured
Over the 2025 and 2026 growing seasons, projects with declining soil organic carbon averaged larger yield losses in the drought conditions, between 20 and 50 per cent, while projects with stable or increasing carbon typically stayed closer to average, between 5 and 15 per cent down.
This clearly equates to a huge P&L differential that we believe is too severe not to track. Without routine measurement, soil carbon decline goes unseen and in-year production risk compounds into business risk. Soil carbon monitoring is becoming a risk-management tool.
David Wright, chief executive, Ecometric
The more extreme the weather, the higher the yield-loss risk, so a changing climate is exposing soil problems through yield variability. The soils with stable or increasing carbon are doing a better job of moderating those shocks, primarily through the relationship between soil carbon and water infiltration and holding.
The finance and insurance industries have picked up on the same relationship and are beginning to value evidenced soil resilience through rate reductions on working capital and mortgages. When the financial apparatus starts to value something, it is worth tracking.
Same soil. Same weather. Opposite outcomes.
Heavy rain is when soil is most exposed. Water moving across bare or low-cover ground carries carbon-rich topsoil with it, and a wet winter can undo years of careful work in a single season. In one such year, two farms on the same clay loam went in opposite directions.
- Farm 1 – no regenerative practices: no cover cropping, very little catch cropping, no organic nitrogen. Soil organic carbon change: −28 t/ha.
- Farm 2 – regenerative practices: cover cropping, organic nitrogen applied. Soil organic carbon change: +7 t/ha.
One farm lost ground in the year that tested it. The other gained. That is what a regenerative system looks like under stress – and it is only visible because both were measured.
Source: Ecometric UK monitoring results, published in The Practical Considerations of Soil Health Measurement for Codex Planetarius, WWF, December 2025.
Why carbon shows up in yield
Soil organic carbon governs structure, infiltration, water holding and nutrient availability. When it declines it declines invisibly, and the first evidence is often significant yield loss in a poor growing season. Rising soil carbon reflects better structure, more water infiltrating and held, and more organic nutrients available to the crop. This is what protects yield and cashflow through the weather events that punish everyone else.
What builds it
Those gains come from keeping living roots and canopy for as much of the year as possible, more diversity in the rotation, less cultivation, and returning residue and organic manures to the soil. Measuring your own soil is what tells you what works on your farm, rather than in principle.
Why this is only visible if you measure every year
Soil carbon loss does not appear in a yield map, a soil test or a set of accounts. It appears in a poor season, as yield loss you cannot explain, and by then decline may have been happening for years – slow enough to miss and hidden by artificial inputs. Annual measurement against your own baseline, field by field, shows which practices held the soil and which cost you in that year’s weather, while the fix is a rotation change rather than a rebuild.
Every result on our reports is measured, not modelled: real soil samples analysed by dry combustion in an ISO-accredited laboratory, tied to satellite imagery at 100 readings a hectare, with the error measured against samples the AI never saw and deducted in full. The method went through four rounds of independent scientific review to earn Regen Registry accreditation, is audited by Carbon Direct and Nova-Cert, verified to ISO 14065, and rated by BeZero in the global top 30%.
Questions we are asked about this
Is the link between soil carbon and yield proven?
It is emerging, observed across our monitoring programmes at project level, and individual field responses vary. We report it as what we see, not as a guarantee. What is not in doubt is what soil organic carbon does for structure, infiltration and water holding – and that a farm cannot manage a number it never measures.
How is a wet year different from a dry one?
In a dry year the soil that holds water holds yield. In a wet year the soil with cover and structure holds its carbon instead of losing it as topsoil. The two farms above were measured in a wet year; the two droughts are the other side of the same coin.
How do I find out what my own fields are doing?
Send us your SBI number and your hectares and we will send a written quote within two working days. Minimum project area is 150 hectares. Pricing depends on the tier you choose – see what sets the price per hectare. Contact us.
Part of our guide to soil carbon measurement for farms. Related: soil carbon testing for your farm · why once a year · how the accuracy is stated · how soil carbon is measured · does regenerative farming build soil carbon.
